ARCHIVED: In Oncourse Gradebook, how do categories and weighting affect grade calculation for percentage gradebooks?
The way your gradebook calculates course grades depends on how you have set it up. For more about setting up the Gradebook, see ARCHIVED: Using categories and weighted grades in Gradebook. The following examples illustrate how the different choices in will affect how students' course grades are calculated.
On this page:
- Displaying grades as percentages with no categories and no weighting
- Displaying grades as percentages with simple categories and no weighting
- Displaying grades as percentages with weighted categories
Displaying grades as percentages with no categories and no weighting
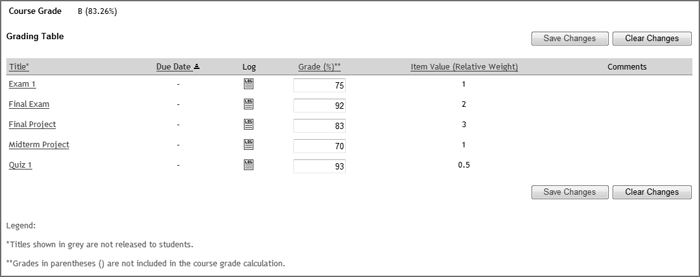
In this example, the instructor has set up the gradebook with no categories and no weighting.

| Title | Grade (%) | Item value (Relative weight) |
|---|---|---|
| Exam 1 | 75 | 1 |
| Final Exam | 92 | 2 |
| Quiz 1 | 93 | 0.5 |
| Final Project | 83 | 3 |
| Midterm Project | 70 | 1 |
The course grade is the sum of all the grades multiplied by their respective relative weights, divided by the sum of the weights.
Course grade: 83.26% [(1*75+2*92+0.5*93+3*83+1*70)/7.5]
Displaying grades as percentages with simple categories and no weighting
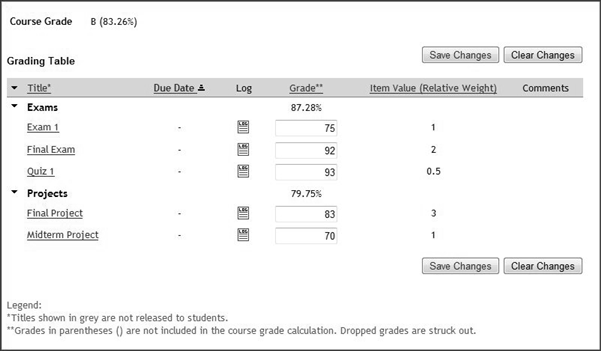
In this example, the instructor has set up the gradebook with simple, unweighted categories.

| Category | Title | Grade (%) | Item value (Relative weight) |
|---|---|---|---|
| Exams | Exam 1 | 75 | 1 |
| Final Exam | 92 | 2 | |
| Quiz 1 | 93 | 0.5 | |
| Projects | Final Project | 83 | 3 |
| Midterm Project | 70 | 1 |
As in the example with no categories, the course grade is the sum of all the grades multiplied by their respective relative weights, divided by the sum of the weights.
Course grade: 83.26% [(1*75+2*92+0.5*93+3*83+1*70)/7.5]
With simple categories, the instructor is able to see the student's overall percentage for each category, which is calculated in the same way as the course grade. For example:
Total (Projects): 79.75% [(3*83+1*70)/4]
However, these category percentages do not affect the student's grade for the course.
Displaying grades as percentages with weighted categories
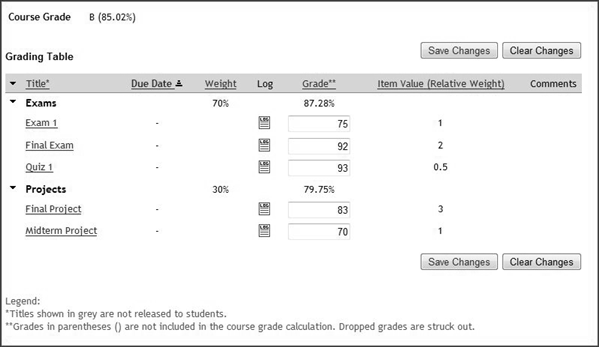
In this example, the instructor has set up the gradebook with weighted categories.

Category Exams (70% weight)
| Title | Grade (%) | Item value (Relative weight) |
|---|---|---|
| Exam 1 | 75 | 1 |
| Final Exam | 92 | 2 |
| Quiz 1 | 93 | 0.5 |
Total (Exams): 87.28% [(1*75+2*92+0.5*93)/3.5]
The total percentage for the category is the sum of the grades multiplied by their respective relative weights, divided by the sum of the weights.
Category Projects (30% weight)
| Title | Grade (%) | Item value (Relative weight) |
|---|---|---|
| Final Project | 83 | 3 |
| Midterm Project | 70 | 1 |
Total (Projects): 79.75% [(3*83+1*70)/4]
Overall course grade (Exams and Projects): 85.02%
| Category | Weight | Contribution to grade |
|---|---|---|
| Exams | 70 | 61.1% (70%*87.28%) |
| Projects | 30 | 23.92% (30%*79.75%) |
| Total | 85.02% (61.1%+23.92%) |
In the unweighted scenarios above, the sum of the relative weights for the exams was 3.5, which is about 47% of the overall sum of the relative weights for the course, while the projects were collectively worth 4/7.5, or about 53% of the total grade. With weighted categories, the instructor has set those weights to 70% and 30%, respectively. Since this hypothetical student did better on the exams than on the projects, the course grade is higher than without the category weights.
This is document axws in the Knowledge Base.
Last modified on 2018-01-18 16:09:23.